
A quick guide to scoring tests
When a pupil sits a test, and that test is marked, the number of correct marks obtained is their raw score. Perhaps a candidate got 50 out of 57. Raw scores are useful to parents to help their child prepare of the test, but not terribly useful to compare, say, different tests with different totals. A common way to modify raw scores in schools is to convert them to percentages scores.
Percentage scores are derived by dividing the raw score by the total available marks and then multiplying by 100. This scales the raw score up as if the test was not out of 57 but actually out of 100.
So, (50 ÷ 57) x 100 = 87.719 % or 88%
Percentage scores are very useful and teachers will use them throughout your child’s school journey to score tests but there are a couple of slight problems with them for really important tests, like the transfer test. Firstly, they don’t take in to account the age of the candidate. It’s not really fair to compare a P7 child with a June birthday against a another P7 child with a August birthday as the latter is nearly one full year older. One way around this problem is to create a Standardised Age Score.
The Standardised Age Score (SAS) allows pupils to be compared only to other candidates that are the same age as them in months. It furthermore allows direct comparison between “easier” test papers and more “difficult” test papers, or papers of different years. The SAS is scored like IQ tests. The raw scores of every candidate are adjusted until the median (average – middle) candidate scores exactly 100.
If you lined up all the test candidates who were born in the same month from lowest score to the highest score, then the person exactly in the middle will be awarded an SAS of 100.
Furthermore, the adjustment of raw scores to standard age scores also ensures that approximately two-thirds of pupils in the age group score between 85 and 115 – one third on either side of 100. Approximately 95 percent of candidates score between 70 and 130 and over 99 percent (or virtually everyone) scores between 60 and 140.
The old AQE scores were SAS scores. This is why so many schools’ lowest entry grades were in around 100. A little over half the candidates who sit the transfer test got a place in a grammar school.
Normal Distribution
All this will be vaguely familiar to parents who studied A-level Maths at school as it follows something called a Normal distribution with a mean of 100 and a standard deviation of 15.
So how do SEAG score their tests?
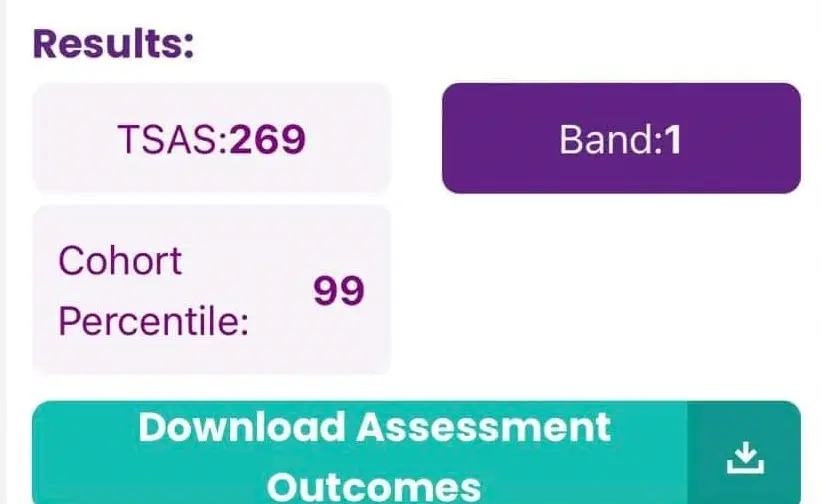
SEAG TSAS results lie in the range of 138 to 282
SEAG (or, rather, GL who set and mark the tests on SEAG’s behalf) score the Maths and English sections separately and calculate a final SAS for both sections, over the two tests. Then, they add these Maths and English scores together to get a “Total SAS”, or TSAS. So, SEAG’s TSAS ends up looking something like this…
Note that it’s not exactly like this. The fact that many children are better at Maths or better at English puts a slight downward pressure on the total scores and so the distribution of the TSAS isn’t quite as high as it would be if it was standardised as a single grade. But it should be close to this.
SEAG Percentile and Band Scores
SEAG additionally provides the percentile that an individual score sits in. To do this, they split all the candidates into 100 evenly sized groups. Schools don’t traditionally select on percentile preferring to use TSAS or percentile band, as described below.
SEAG also provide the “percentile band” that the candidate sits in. This is close to the old GL Grading system A, B1 etc. Schools can decide to use this to select their pupils rather than the TSAS.
Outcomes are given as one of six bands; the bands are designated as Band 1, Band 2, Band 3, Band 4, Band 5 and Band 6 with Band 1 being the highest and Band 6 being the lowest. Unlike percentiles, these are not equally sized groups. Band 1 is the top 40% of candidates while Band 2 is the next 10% of candidates and so on. Bands 3,4 and 5 are 10% while Band 6 is the lowest 20% of scores. This allows some schools to select, say, just band 1 but allow other selection criteria (such as older sibling) to tie-break which helps keeps families together.
So, when will we get these results?
SEAG then provide several scores to candidates in late January / early February, via their online portal.